1441 Jonesville Rd, Simpsonville
About 18 single-family lots fit by right.
14.74 acres on the tax map. 0.43 acres sit in a mapped flood hazard area or wetland. The count is limited by the minimum lot size.
- single-family lots
- 18
- buildable after setbacks and hazards
- 12.68 ac
- in a mapped flood hazard area
- 0.43 ac
- needed for apartments
- Rezoning
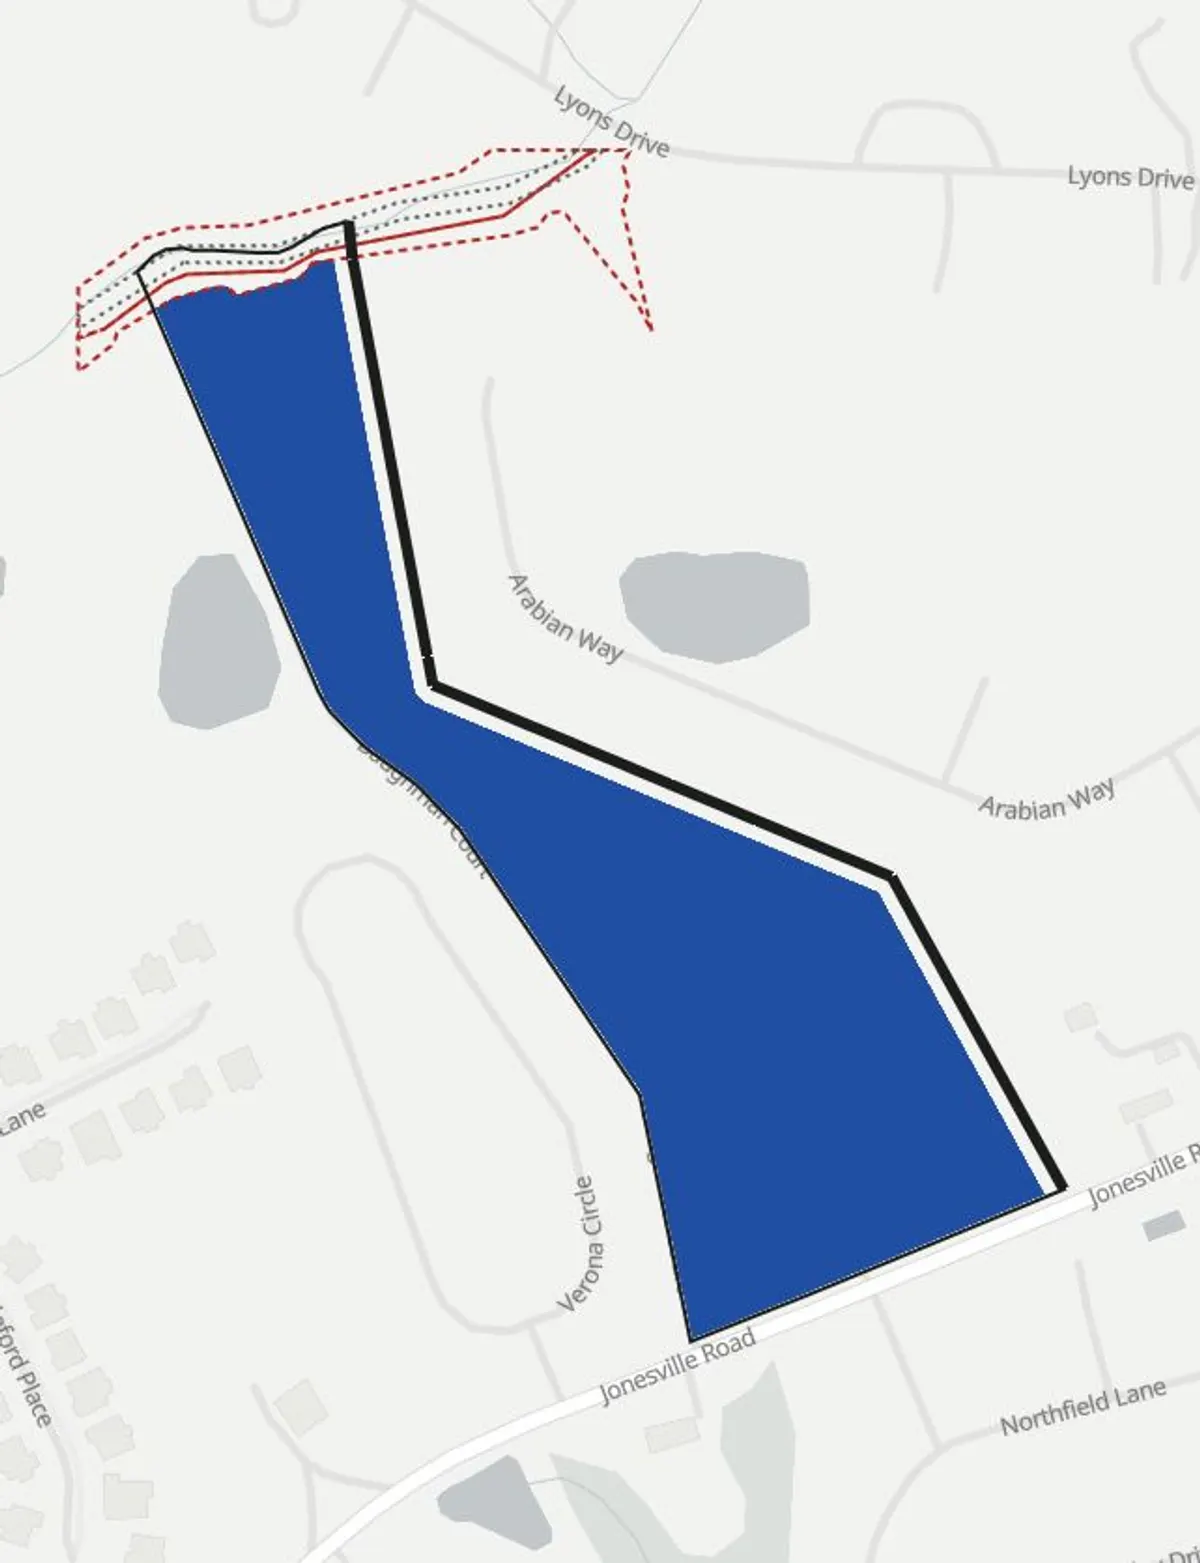
Where the land goes
| Land | Acres | Share |
|---|---|---|
| Buildable after setbacks | 12.68 ac | 86% |
| Setback strips | 1.63 ac | 11% |
| Flood hazard area | 0.43 ac | 3% |
The parcel holds 0.43 acres of mapped flood hazard area and 0.16 acres of mapped wetland, both left out of the buildable area.
What fits
| Use | Zoning | Fits | Limited by |
|---|---|---|---|
| Single-family lots | By right | 18 lots | the minimum lot size |
| Apartments | Needs rezoning | 22 apartments | the density limit |
Lots are counted on the land left after a share for streets and open space, at the district's minimum lot size and density. A site plan sets the final count.
Listing
- List price
- $3,000,000
- Per acre on the tax map
- $203,537
- Listed by
- Palmetto Home Real Estate
Parcel
- Parcel line source
- Greenville County parcels, February 2026 extract (covers part of the county)
- Jurisdiction
- Unincorporated Greenville County
- Zoning district
- R-S Residential Suburban District
- Zoning map source
- Greenville County zoning districts, an ArcGIS Online copy hosted by a third party (last edited October 2025)
- Flood map source
- FEMA National Flood Hazard Layer, flood hazard zones
- Front edge
- Longest edge, assumed
Zoning limits
| Limit | Value | Source |
|---|---|---|
| Front setback | 30 ft | County Zoning Ordinance, Table 7.3 |
| Side setback | 5 ft | County Zoning Ordinance, Table 7.3 |
| Rear setback | 5 ft | County Zoning Ordinance, Table 7.3 |
| Density limit | 1.50 per acre | County Zoning Ordinance, Table 7.1 |
| Minimum lot size | 25,000 sf | County Zoning Ordinance, Sec. 5:4.5 |
| Height limit | 45 ft | County Zoning Ordinance, Table 7.3 |
People nearby
| Ring | People | Households | Renting | Income |
|---|---|---|---|---|
| 1 mi | 4,964 | 1,646 | 18.5% | $121,172 |
| 3 mi | 40,069 | 14,338 | 12.1% | $123,962 |
| 5 mi | 109,214 | 41,687 | 21.0% | $112,140 |
U.S. Census Bureau, ACS 2024 5-year estimates by block group. A block group counts when its center falls inside the ring. Income and rent are averages of block group medians, weighted by households and renter households.
For buyers to confirm
- The district, its limits, and any overlay, with the planning office.
- Sewer and water capacity, with the utility.
- Exact lines and wetlands, with a boundary survey and a delineation.
- The current FEMA flood map panel.
A preliminary screen built from public data at feasibilityconsulting.com. It counts what the zoning allows on the mapped land. It is not an appraisal or opinion of value, a survey, a site plan, an engineering study, or a zoning determination. Parcel lines come from the tax map.