3753 W Warehouse Ct, Taylors
Best fit: 25 single-family lots.
At these inputs the land can carry about $447,500 as single-family lots. The asking price of $750,000 is $302,500 above that. As finished lots, the price works if lots sell for $83,596 or more, against $70,000 assumed.
- single-family lots
- 25
- the land can carry
- $448K
- margin before land
- 36.6%
- over what the land can carry
- $303K
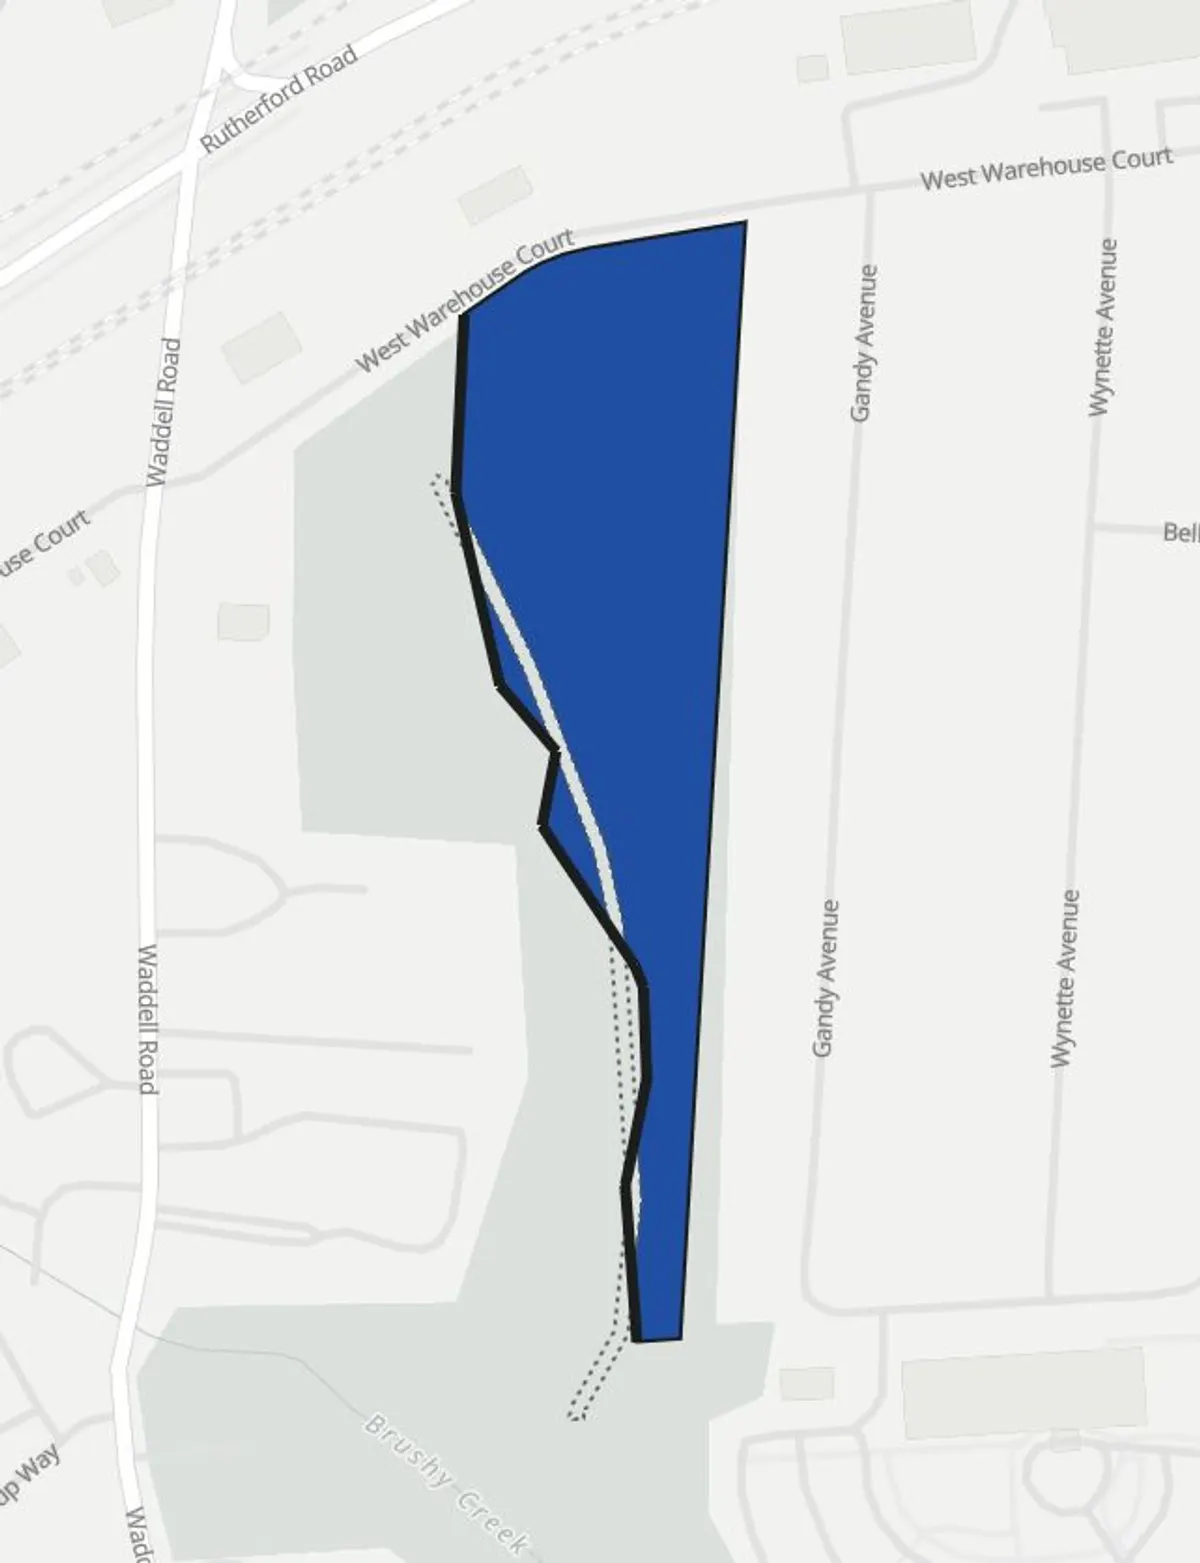
Where the land goes
| Land | Acres | Share |
|---|---|---|
| Buildable after setbacks | 7.70 ac | 96% |
| Wetland outside the flood area | 0.35 ac | 4% |
The parcel holds 0.00 acres of mapped flood hazard area and 0.35 acres of mapped wetland, both left out of the buildable area.
Three uses compared
| Use | Single-family lots | Single-family homes | Apartments |
|---|---|---|---|
| Zoning | Not on file | Not on file | Not on file |
| Yield | 25 lots | 25 homes | 291 apartments |
| Revenue or value | $1,750,000 | $9,000,000 | $52,569,351 |
| Cost before land | $1,110,000 | $7,665,000 | $68,052,191 |
| Return before land | 36.6% | 14.8% | 4.5% |
| Land can carry | $447,500 | $345,000 | -$22,339,712 |
Land can carry means the residual land value: revenue or stabilized value, less every cost before land, less the developer return. Single-family lots: limited by an assumed lot size (no minimum on file). Single-family homes: limited by an assumed lot size (no minimum on file). Apartments: limited by room for buildings and parking on the site.
Pro forma, single-family lots
| Lot sales, 25 lots at $70,000 | $1,750,000 |
| Lot development at $40,000 per lot | $1,000,000 |
| Soft cost at 11% | $110,000 |
| Cost before land | $1,110,000 |
| Developer margin at 11% of revenue | $192,500 |
| Land can carry | $447,500 |
| Profit at the land price entered, -6.3% of revenue | -$110,000 |
Parcel
- Owner of record
- JORDAN MINISTERIO DE RESTAURAC (2019 record)
- Parcel line source
- Greenville County parcels, 2019 extract (full county; check for later splits)
- Jurisdiction
- Unincorporated Greenville County
- Zoning district
- R-MHP, R-M20, limits entered by hand
- Zoning map source
- Greenville County zoning districts, an ArcGIS Online copy hosted by a third party (last edited October 2025)
- Flood map source
- FEMA National Flood Hazard Layer, flood hazard zones
- Front edge
- Longest edge, assumed
Zoning limits used
Zoning limits were entered by hand.
People nearby
| Ring | People | Households | Renting | Income | Rent |
|---|---|---|---|---|---|
| 1 mi | 4,537 | 1,845 | 50.0% | $55,442 | $903 |
| 3 mi | 63,053 | 26,395 | 37.7% | $84,099 | $1,185 |
| 5 mi | 152,875 | 65,493 | 41.1% | $78,723 | $1,259 |
U.S. Census Bureau, ACS 2024 5-year estimates by block group. A block group counts when its center falls inside the ring. Income and rent are averages of block group medians, weighted by households and renter households.
Before an offer
- Confirm the district, its limits, and any overlay with the planning office.
- Confirm sewer and water capacity with the utility.
- Order a boundary survey and a wetland delineation.
- Check the FEMA flood map panel and any pending map revision.
- Replace the cost and price assumptions with local bids and comparable sales.
A preliminary screen built from public data and stated assumptions at feasibilityconsulting.com. It is not an appraisal, survey, engineering study, legal opinion, or zoning determination. Parcel lines come from the tax map. A boundary survey sets the exact lines.